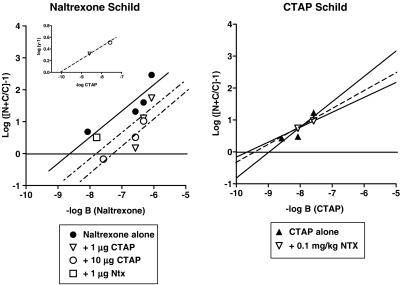
Figure 4.
Secondary Schild plots for naltrexone (left panel) or CTAP (right panel) as antagonists of the antinociceptive effects of morphine. Left panel: Schild plots for naltrexone alone and in the presence of 1 or 10 μg CTAP i.c.v. Individual potency estimate for naltrexone in the presence of a single dose of 1 μg naltrexone (open squares). Slopes of the regression lines were not significantly different so regressions lines were drawn with a common slope calculated to be −0.87 (for details see ‘Data Analysis'). Right panel: Schild plots of CTAP alone and in the presence of 0.1 mg kg−1 naltrexone. Ordinate: logarithm of the quantity [(N+C (A50 of the agonist in the presence of a constant dose of CTAP and increasing dose of naltrexone) divided by C (A50 of the agonist plus a constant dose of CTAP)]-1). A50 values are determined from Figures 2, 3. Abscissa: negative logarithm of molar doses of naltrexone (left panel) or CTAP (right panel). Inset: resultant plot for CTAP. Ordinate: logarithm of the quantity (y−1), where y is the equal dose ratio for naltrexone in the presence of 1.0 or 10 μg CTAP. Abscissa: negative logarithm of molar doses of CTAP.

