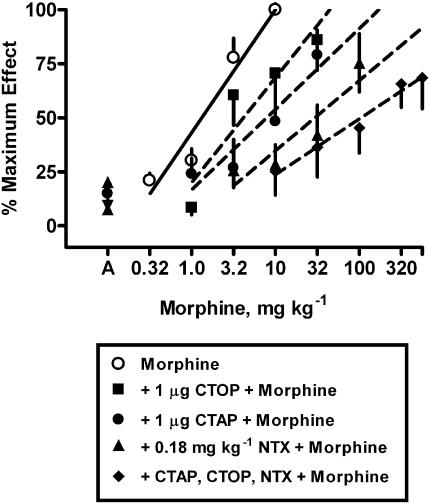
Figure 5.
Effects of CTOP i.c.v. in the presence of a fixed dose of 0.18 mg kg−1 naltrexone s.c. and 1 μg CTAP i.c.v. CTOP i.c.v., naltrexone s.c. or CTAP i.c.v. were administered alone or in combination 25 min before determination of the morphine dose–response curve. Points above A are the effects of the antagonist or antagonist combination alone. Each point represents the mean of one observation in 6–8 rats. Other details as in Figure 1.

