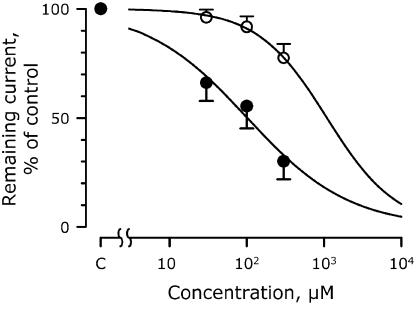
Figure 1.
The blocking effects of moxifloxacin and azithromycin on IhERG expressed in HEK 293 cells. Data points represent the means of four cells. Concentration–response curves are shown, where the remaining current is plotted relative to its control level. Closed circles, moxifloxacin with an IC20 and IC50 of 12 and 102 μM, respectively, and a Hill coefficient of 0.66. Open circles, azithromycin with corresponding values of 265, 1091 and 0.97 μM.

