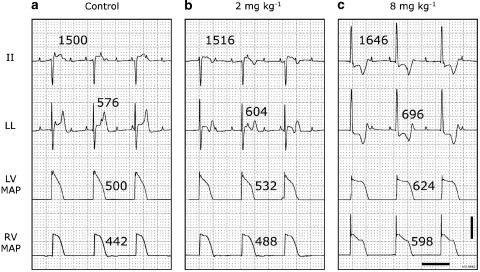
Figure 3.
Electrophysiological effects of cumulative doses of moxifloxacin in a representative anaesthetized dog with CAVB. Two ECG leads, LV and RV MAP recordings are shown in each panel. RR intervals are above lead II and QT times above lead LL. MAPDs are next to the action potentials. ECG calibrated to 1 mV cm−1. Scale bar, 20 mV on the MAP signals. Horizontal scale bar, 1 s. (a) Control situation before moxifloxacin administration. (b) 10 min after start of 2 mg kg−1 moxifloxacin infusion. (c) 10 min after start of 8 mg kg−1 moxifloxacin infusion. The low dose causes a change in the T-wave morphology, whereas the high dose alters the ventricular origin of activation. No TdP was observed with any dose of moxifloxacin. In this example, the plasma concentrations measured at the time of these tracings were 1.6 and 8.6 μg ml−1 after 2 and 8 mg kg−1, respectively.

