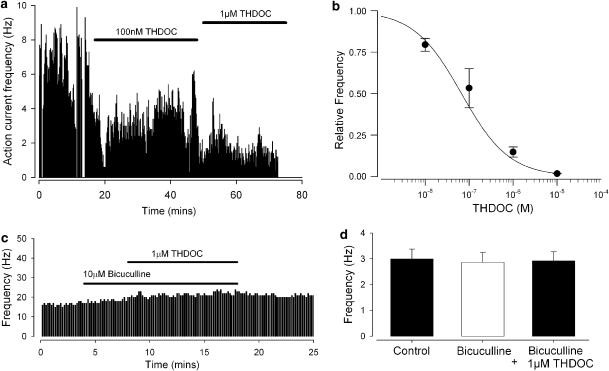
Figure 1.
THDOC decreases action current frequency in spinally projecting parvocellular neurones. (a) Action currents recorded in retrogradely spinally projecting parvocellular neurones in cell-attached patch mode; frequency (Y-axis) is plotted against time (X-axis). THDOC (100 nM and 1 μM) was added where indicated by the bars. (b) Summary of five experiments as illustrated in (a), but with a range of concentrations. The smooth line represents an error-weighted fit to the mean data (Equation 1); best fit parameters were EC50 67 nM with 95% CLs of 54 and 84 nM, Hill coefficient 0.8±0.04, n=5. X-axis is a log scale. (c) Representative figure showing the lack of effect of 1 μM THDOC when applied in the presence of the GABAA antagonist, bicuculline. (d) Mean data from seven experiments, as illustrated in (c) bicuculline concentration 10 μM. Action current frequency in the presence of THDOC and bicuculline was not significantly different from that in either control or 10 μM bicuculline (ANOVA, n=7).

