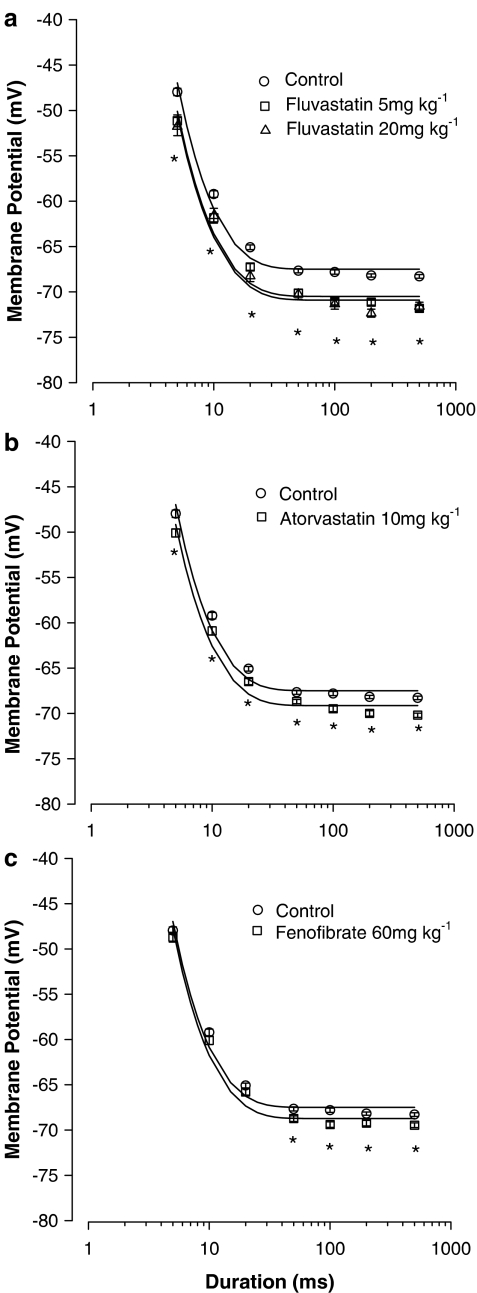
Figure 3.
MT for contraction measured in EDL muscle fibres of fluvastatin (a), atorvastatin (b) and fenofibrate (c) chronically treated rats with respect to controls. Each point, expressed as mean value±s.e.m. from 124 to 374 fibres of 5–10 rats, show the voltage potential for fibre contraction at each pulse duration measured in different experimental conditions (control and treated animals). *Significantly more negative with respect to control (by Student's t-test, P<0.001). A single asterisk indicates the significant differences of the mean voltage potential measured in rats treated with fluvastatin (5 or 20 mg kg−1 day−1) with respect to that of control rats. The values have been fitted to the equation shown in the Methods section to obtain the strength–duration curves and the calculated values of rheobase (R) are given in the Results section.

