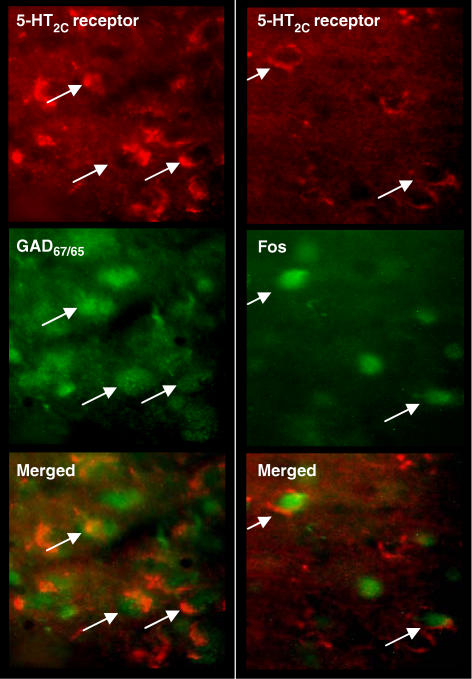
Figure 6.
Photomicrographs of the rat DRN showing fluorescent images of 5-HT2C receptor immunoreactivity with either GAD65/67 immunoreactivity (left) or Fos immunoreactivity induced by WAY 161503 (3 mg kg−1 i.p.) (right). Arrows indicate co-localized neurones as seen in the merged images. Note the presence of GAD positive cells double-labelled with 5-HT2C receptor immunoreactivity. Also Fos positive cells were double-labelled with 5-HT2C receptor immunoreactivity after WAY 161503 administration.

