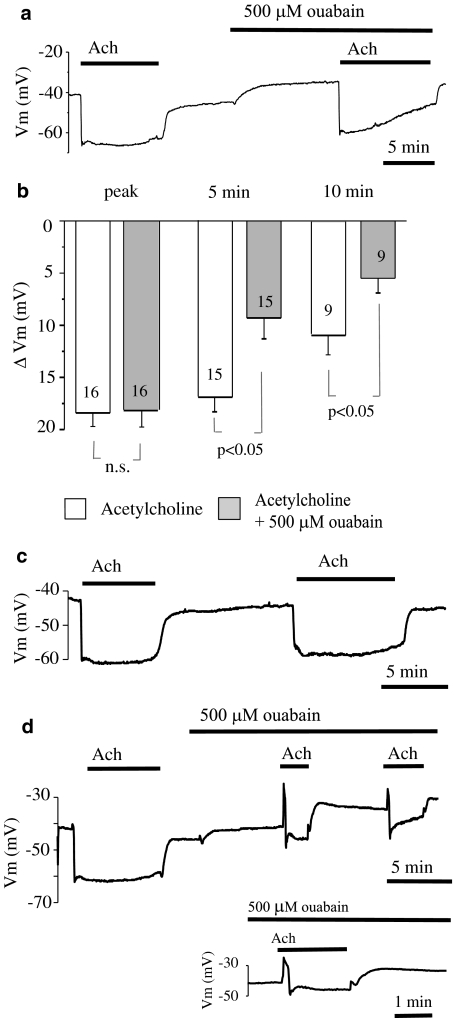
Figure 2.
Effect of 500 μM ouabain on the hyperpolarization of endothelial cells from rat aorta produced by acetylcholine. (a) Original tracing showing the influence of 500 μM ouabain on the hyperpolarization of endothelial cells produced by 2 μM acetylcholine. (b) Graphical representation of the time dependency of the effect of 500 μM ouabain on the mean changes in membrane potential evoked by 2 μM acetylcholine. The changes in membrane potential were calculated as the difference between the membrane potential values before and after acetylcholine administration. Numbers associated with bar plot indicate the number of aorta preparations. (c) Representative record of repeated applications of 2 μM acetylcholine. (d) Original tracing showing attenuation of all phases of acetylcholine-evoked hyperpolarization by 500 μM ouabain that unmasked a transient depolarization phase in response to acetylcholine. For clarity, a portion of the trace has been expanded.

