


Fig. 4.
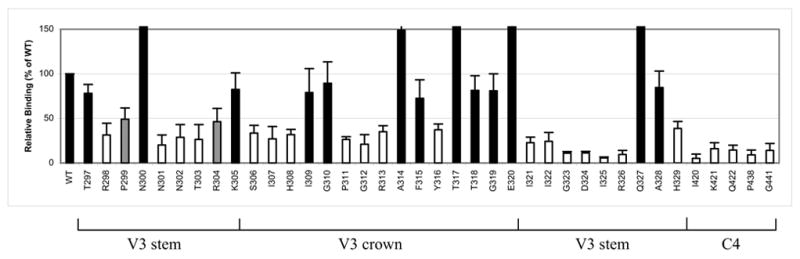
Effect of V3 and C4 mutations on CCR5 binding of soluble gp120-CD4 complexes, as measured by cell-based ELISA. Values are expressed as a percentage of WT. White bars indicate values (mean plus one standard deviation) less than 50%. Gray bars indicate mean values that are approximately 50%. Data shown represent the means and standard deviations of data from at least three independent experiments, with each experiment carried out in duplicate.