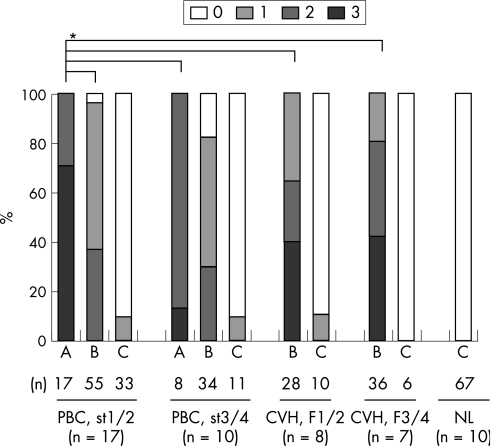
Figure 1 Degrees of regulatory T cells (Tregs) expressing Forkhead box P3 (Foxp3+Tregs) infiltration in portal tracts depending on three types portal tract histopathology in primary biliary cirrhosis (PBC) and control livers. Foxp3+Tregs infiltrated more extensively into portal tracts with chronic inflammation (types A and B) compared with non‐inflamed portal tracts (type C) in PBC and chronic viral hepatitis (CVH). Foxp3+Tregs infiltrated more extensively into portal tracts with (chronic non‐suppurative destructive cholangitis (CNSDC) (type A) in PBC compared with portal tracts without CNSDC in PBC and CVH (p<0.05). A, chronically inflamed portal tracts containing CNSDC; B, chronically inflamed portal tracts without CNSDC; C, non‐inflamed portal tracts. Extent of infiltration: 0, portal tract containing <2 Foxp3‐expressing cells; 1, portal tract containing 2–5 Foxp3‐expressing cells; 2, portal tract containing 6–10 Foxp3‐expressing cells; 3, portal tract containing >10 Foxp3‐expressing cells. NL, normal liver. *p<0.05.

An official website of the United States government
Here's how you know
Official websites use .gov
A
.gov website belongs to an official
government organization in the United States.
Secure .gov websites use HTTPS
A lock (
) or https:// means you've safely
connected to the .gov website. Share sensitive
information only on official, secure websites.
