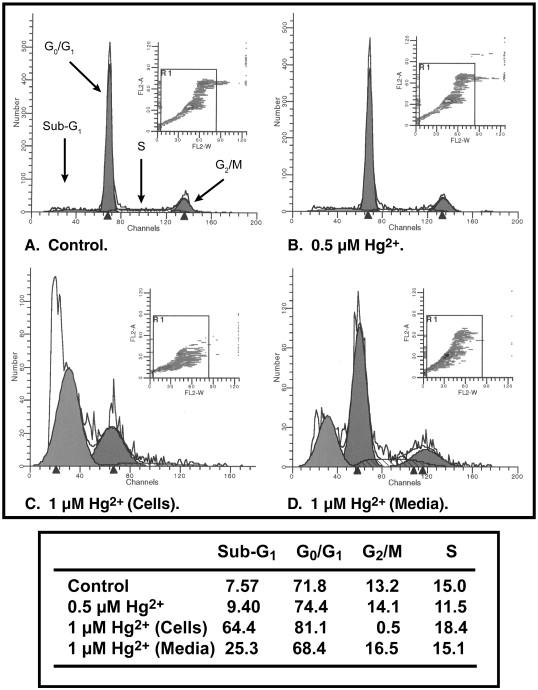
Figure 5. Hg2+-induced apoptosis in primary cultures of rPT cells.

Confluent, primary cultures of rPT cells were grown on 35-mm culture dishes and were incubated with either media (= Control) or 0.5 μM or 1 μM HgCl2 for 24 h. At 1 μM HgCl2, a significant portion of cells became detached from the growth surface. Accordingly, cells remaining on the culture dish and those that were detached after treatment with 1 μM HgCl2 were separately analyzed. Apoptosis and cell cycle distribution were assessed by staining with propidium iodide and flow cytometry with a Becton Dickinson FACSCalibur flow cytometer. Peaks from left to right represent apoptotic (sub-G1) cells and cells in G0/G1, G2/M, and S phases. Insets: Distribution of cells according to fluorescence intensity. Cells outside the box were those excluded from analysis due to aggregation. Values in the table are the percentage of cells undergoing apoptosis and the fraction of cells in each phase of the cell cycle.
