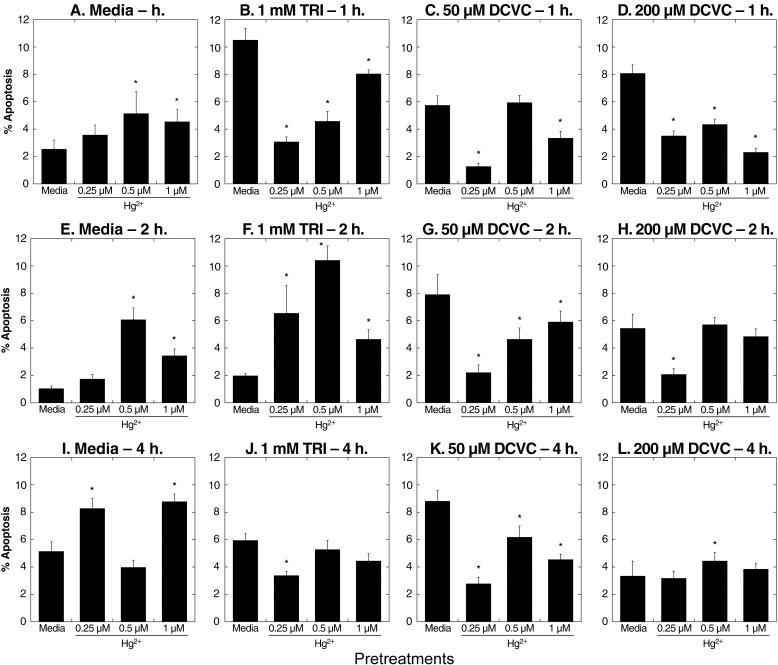
Figure 8. Effects of pretreatment of primary cultures of hPT cells with 0.25 μM Hg2+ on TRI- and DCVC-induced apoptosis.

Confluent, hPT cell cultures were pretreated for 24 h with either media (= Control) or 0.25 μM HgCl2. Cells from the two pretreatment groups were then incubated for 1 h with either media, 1 mM TRI, or 50 μM DCVC. Apoptosis was assessed by staining with propidium iodide and flow cytometry using a Becton Dickinson FACSCalibur flow cytometer. Peaks from left to right represent apoptotic (sub-G1) cells and cells in G0/G1, G2/M, and S phases. Insets: Distribution of cells according to fluorescence intensity. Cells outside the box were those excluded from analysis due to aggregation. Values above the arrows indicate the percentage of apoptotic cells in each sample.
