
Figure 3.
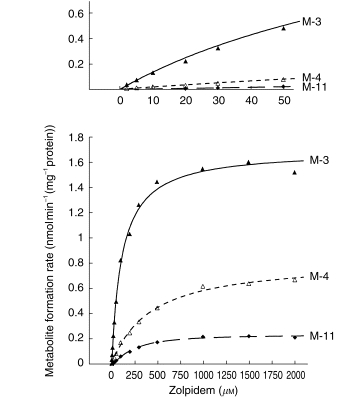
Rates of formation of the M-3, M-4, and M-11 metabolites of zolpidem in relation to concentration of the substrate, zolpidem, by a representative human liver microsomal preparation in vitro. Lines represent functions consistent with Michaelis-Menten kinetics. Insert, above: low substrate concentrations shown on an expanded scale.