
Figure 4.
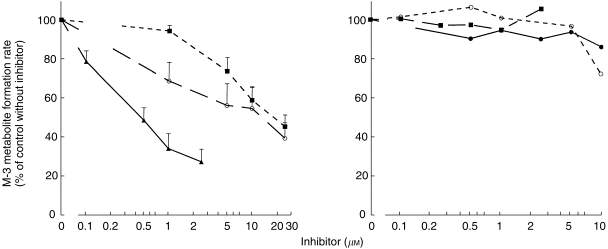
Rates of formation of the M-3 metabolite of zolpidem in relation to concentrations of metabolic inhibitors (▴—▴ ketoconazole, ^—^ itraconazole, ▪–––▪ fluconazole, •—• sulfaphenazole, ▪ – – ▪α-naphthoflavone, ^–––^ quinidine. Reaction velocities were expressed as a percentage ratio vs the control velocity value with no inhibitor present. The zolpidem concentration was fixed at 10 μm. See Table 2 for IC50 values.