
Figure 6.
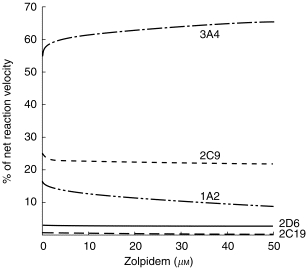
Estimated relative contribution of five human cytochromes to net rate of zolpidem biotransformation in vitro. Functions were generated using reaction velocity vs substrate concentration relationships for the five cDNA-expressed cytochromes (Table 3 and Figure 5), after normalization for relative abundance of the individual cytochromes (RA values in Table 3).