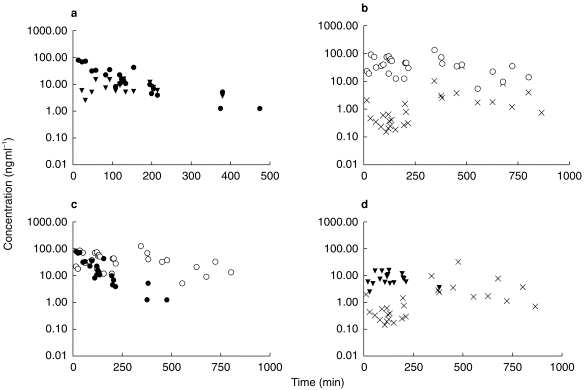
Figure 2.

Comparison of (a) morphine concentrations in plasma and CSF. (b) morphine-6-glucuronide concentrations in plasma and CSF. (c) morphine and M6G concentrations in plasma. (d) morphine and M6G concentrations in CSF. • =plasma morphine, ▾ =CSF morphine, ○ =plasma M6G, x =CSF M6G.
