Figure 1.

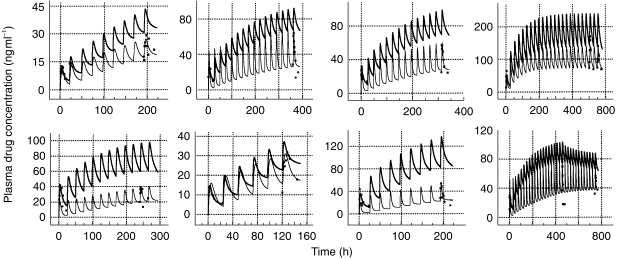
Predictions of plasma methadone concentrations during continuous drug administration from single dose (thicker line) or late dose (thinner line) data. Experimental data are normalised for a dose of 10 mg methadone HCl and indicated by ▪.

Predictions of plasma methadone concentrations during continuous drug administration from single dose (thicker line) or late dose (thinner line) data. Experimental data are normalised for a dose of 10 mg methadone HCl and indicated by ▪.