
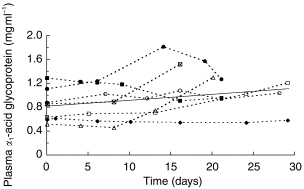
Figure 6.
Plasma α1-acid glycoprotein concentrations in subjects taking part in protocol G3. Solid line indicates the best regression fit (r2 = 0.054; P=0.17).
Official websites use .gov
A
.gov website belongs to an official
government organization in the United States.
Secure .gov websites use HTTPS
A lock (
) or https:// means you've safely
connected to the .gov website. Share sensitive
information only on official, secure websites.
Plasma α1-acid glycoprotein concentrations in subjects taking part in protocol G3. Solid line indicates the best regression fit (r2 = 0.054; P=0.17).