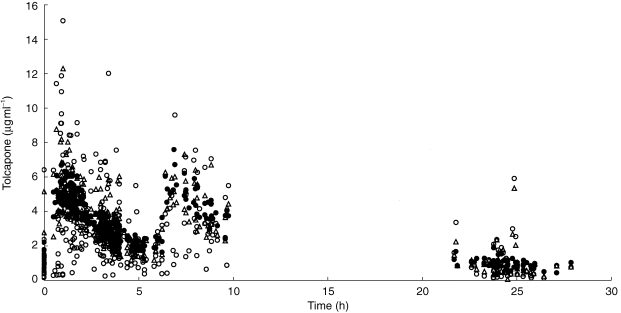
Figure 2.

Measured (DV, ○), individually predicted (CP, ▵) and typically predicted (PRED, •) concentrations of tolcapone vs time for the 200 mg dose in the fluctuator data set. The time is given relative to the first drug intake of the day (time 0) with subsequent drug intakes at 6 and 12 hours.
