Figure 1.

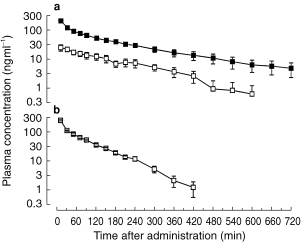
Semi-logarithmic plot of the mean concentration-time curves of midazolam (▪) and α-hydroxy-midazolam (□) after intravenous administration of midazolam (a) or α-hydroxy-midazolam (b) (0.15 mg kg−1 over 4 min) in six healthy volunteers.

Semi-logarithmic plot of the mean concentration-time curves of midazolam (▪) and α-hydroxy-midazolam (□) after intravenous administration of midazolam (a) or α-hydroxy-midazolam (b) (0.15 mg kg−1 over 4 min) in six healthy volunteers.