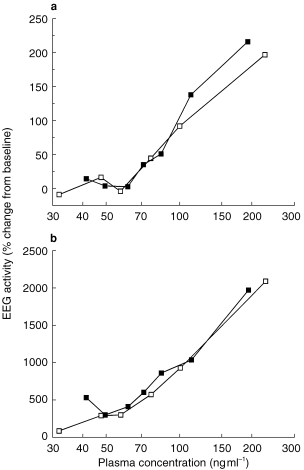
Figure 2.

(a) Relationship between plasma concentration and percentage change in EEG beta activity (13–30 Hz) after intravenous administration of midazolam (▪) and α-hydroxy-midazolam (□), respectively. Data are expressed as means of six healthy volunteers. (b) Relationship between plasma concentration and percentage change in EEG activity in the frequency range from 13.5 to 15.5 Hz after intravenous administration of midazolam (▪) and α-hydroxy-midazolam (□), respectively. Data are expressed as means of six healthy volunteers. Changes in the lower beta range (13.5–15.5 Hz) were much more pronounced compared with the total change in the range from 13 to 30 Hz.
