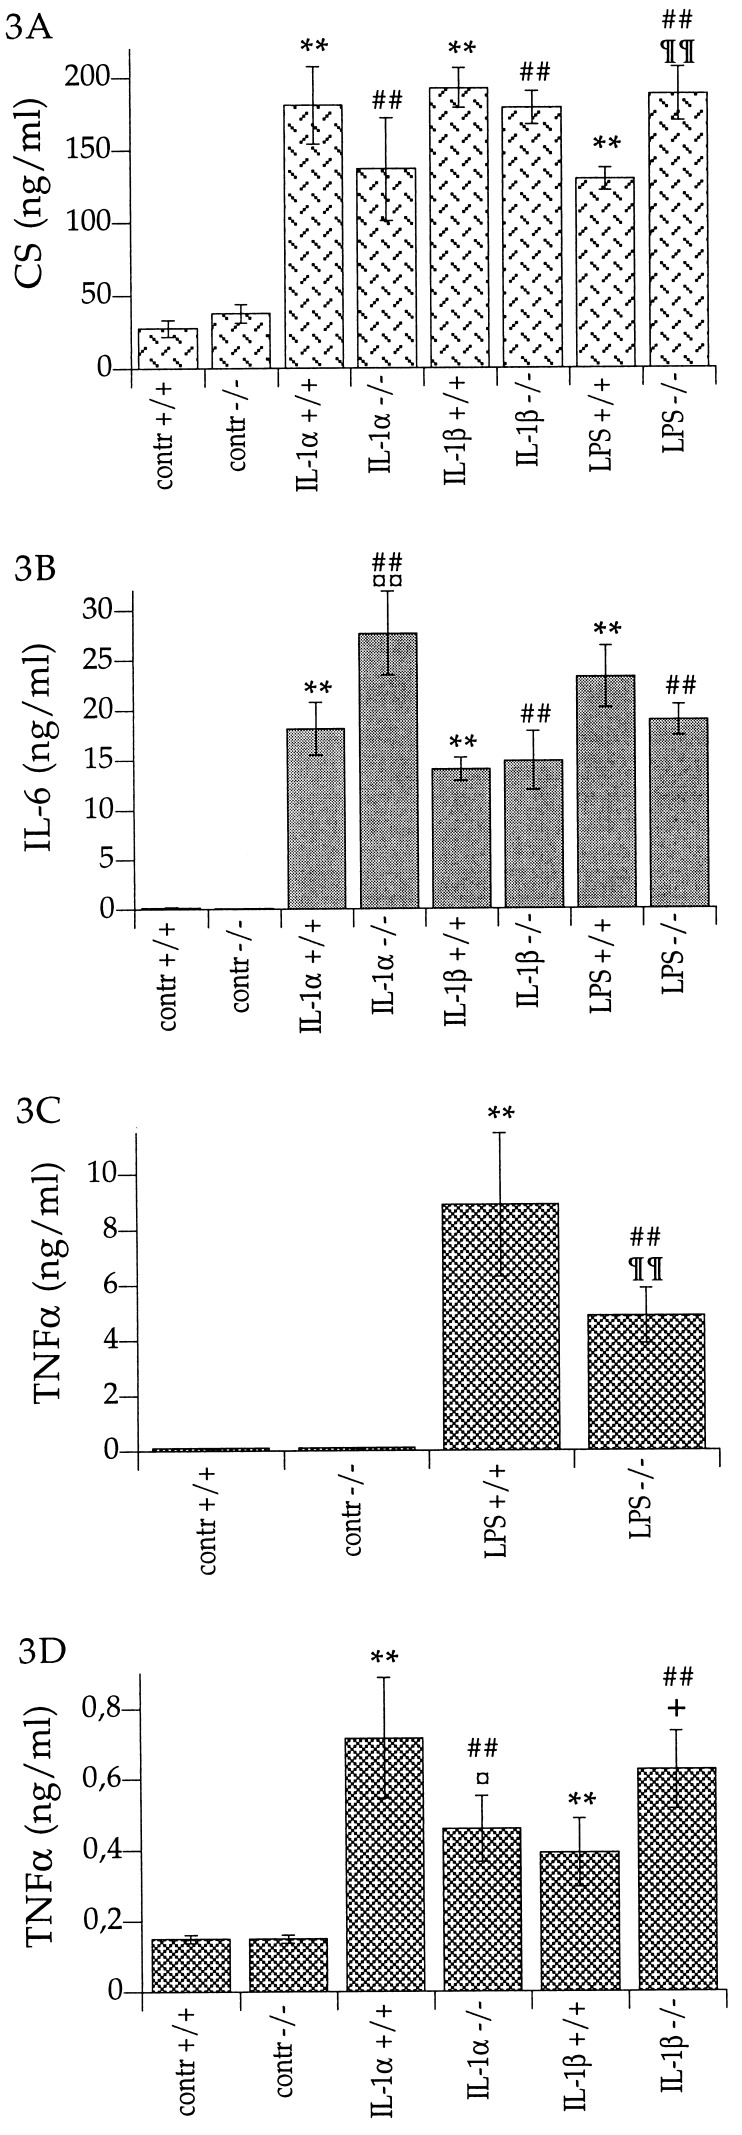
Figure 3.
(A) Serum corticosterone levels in IL-1β-deficient mice (−/−) and wild-type mice (+/+) after injection of rrIL-1α (10 μg per kg of body weight, i.p.) [IL-1α]; rrIL-1β (10 μg per kg of body weight, i.p.) [IL-1β]; LPS (5 mg per kg of body weight, i.p.) [LPS]; or saline [contr]. ∗∗, P < 0.01 vs. control +/+; ##, P < 0.01 vs. control −/−; and ¶¶, P < 0.01 vs. LPS +/+. Control +/+, n = 12; control −/−, n = 12; IL-1α +/+, n = 4; IL-1α −/−, n = 3; IL-1β +/+, n = 5; IL-1β −/−, n = 5; LPS +/+, n = 7; and LPS −/−, n = 7. (B) Serum IL-6 levels in IL-1β-deficient mice (−/−) and wild-type mice (+/+), after injection of rrIL-1α (10 μg per kg of body weight, i.p.) [IL-1α]; rrIL-1β (10 μg per kg of body weight, i.p.) [IL-1β]; LPS (5 mg per kg of body weight, i.p.) [LPS]; or saline [contr]. ∗∗, P < 0.01 vs. control +/+; ##, P < 0.01 vs. control −/−; ¤¤, P < 0.01, vs. IL-1α +/+. Control +/+, n = 12; control −/−, n = 12; IL-1α +/+, n = 4; IL-1α −/−, n = 3; IL-1β +/+, n = 5; IL-1β −/−, n = 5; LPS +/+, n = 7; and LPS −/−, n = 7. (C and D) Serum TNFα levels in IL-1β-deficient mice (−/−) and wild-type mice (+/+). (C) TNFα levels in serum after injection of LPS (5 mg per kg of body weight, i.p.) [LPS] or saline [contr]. ∗∗, P < 0.01, vs. control +/+; ##, P < 0.01, vs. control −/−; and ¶¶, P < 0.01, vs. LPS +/+. Control +/+, n = 12; control −/−, n = 12; LPS +/+, n = 7; and LPS −/−, n = 7. Note that the scale on the ordinate is 10-fold higher than in D. (D) TNFα levels in serum after injection of rrIL-1α (10 μg per kg of body weight, i.p.) [IL-1α]; rrIL-1β (10 μg per kg of body weight, i.p.) [IL-1β]; or saline [contr]. ∗∗, P < 0.01, vs. contr +/+; ##, P < 0.01, vs. control −/−; ¤, P < 0.05, vs. IL-1α +/+; and +, P < 0.05, vs. IL-1β +/+. Control +/+, n = 12; control −/−, n = 12; IL-1α +/+, n = 5; IL-1α −/−, n = 5; IL-1β +/+, n = 5; and IL-1β −/−, n = 5.

