
Figure 2.
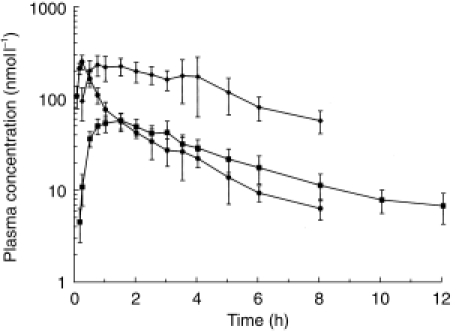
Mean plasma concentrations of morphine (•), M6G (▪) and M3G (✦) after s.c.b. administration of morphine to six healthy volunteers. Error bars indicate standard deviation (s.d.).(Corrected to a dose of 10 mg/70 kg. Data shown are themean of at least three values).