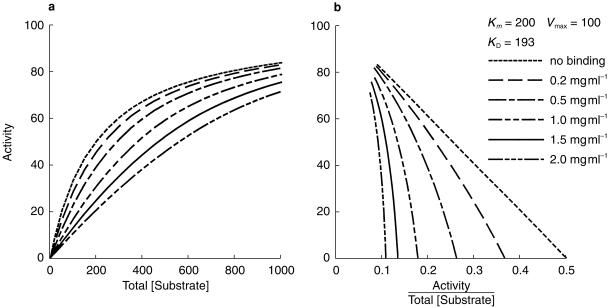
Figure 4.
Simulation showing the effect of varying microsomal protein concentration on Michaelis-Menten kinetics (a), and on an Eadie Hofstee plot (b). Bmax was assumed to be proportional to microsomal protein concentration. Substrate concentration ranges used in kinetic studies are commonly 0.2 Km −3 Km.

