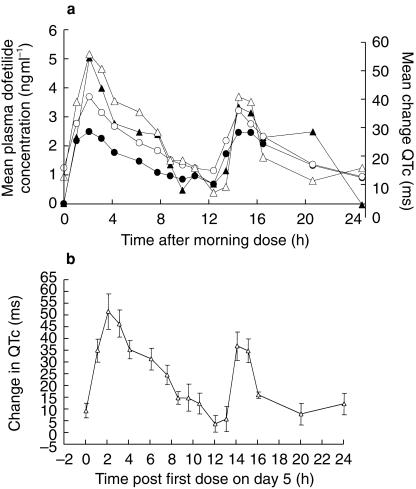
Figure 2.
a) Mean plasma dofetilide concentration (ng ml−1) and changes in the QTc interval (ms) during the 24 h after the morning 500 µg dose on days 1 and 5 with a twice daily regimen. The circles represent the mean plasma concentration on days 1 (•) and 5 (○). The triangles represent the QTc interval on days 1 (filled triangles) and 5 (open triangles). b) Mean (▵) and s.e.mean QTc changes (ms) vs time (h) following the first dose at steady state (day 5).

