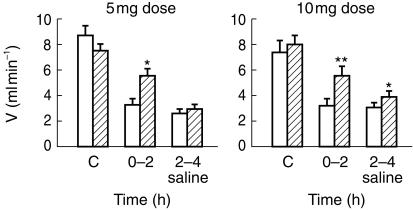
Figure 2.
Urine volume during the 2 h control period (C; −2–0 h), the 2 h postdose collection period (0–2 h) and during the subsequent 2 h (2–4 h) of 2.5% saline infusion after oral administration of single doses of 5 and 10 mg of asimadoline (hatched column) or placebo (open column) in each group of eight healthy subjects. Data are given as means ± s.e.mean; *P < 0.05, **P < 0.01.

