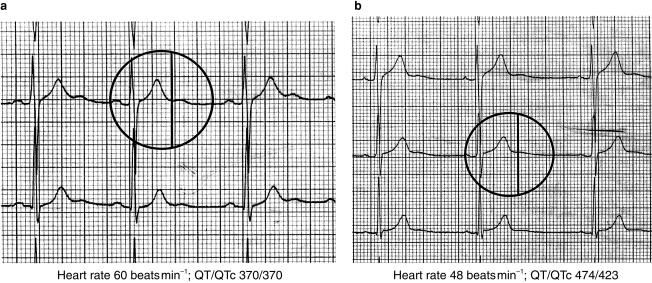
Figure 3.
Two ECGs from a patient recorded at different heart rates. With a heart rate of 60 beats min−1 (a) the QT interval is computed to be 370 ms. This position is indicated by the vertical marker and corresponds to the end of the T wave, just before the onset of a following U wave. With a heart rate of 48 beats min−1 (b) the QT interval is computed to be 474 ms and this position is again indicated by the vertical line. In this case the U wave appears as a gradual return to the iso-electric line after the T wave and the computer incorrectly identifies the end of the T wave, resulting in a longer QTc interval. Computer analysis of the QT interval may be subject to error at slow heart rates and with variable T and U wave morphologies.

