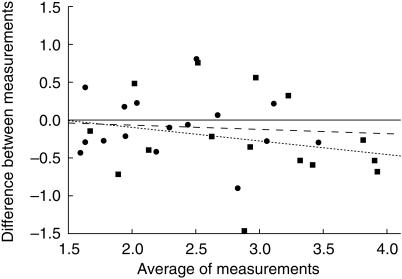
Figure 1.
Difference between the measurements with and without wrist cuff against the average value of the measurements without and with a wrist cuff after a 3 min (•) and after a 12 min (▪) occlusion period. The broken line indicates the regression line for the values after the 3 min occlusion (r2 = 0.01; NS) and the dashed line indicates the regression line for the values after the 12 min occlusion (r2 = 0.06; NS).

