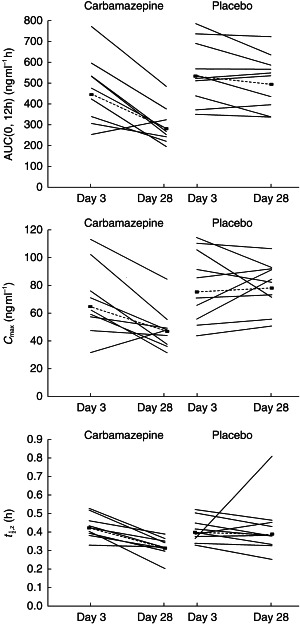
Figure 2.

Mean AUC(0,12 h), Cmax and t½,z on days 3 and 28 in subjects receiving ziprasidone (40 mg day−1) before (day 3) and after (day 28) the administration of placebo or carbamazepine for 21 days. Solid lines (----) represent individual observed values, and dashed lines (▪––––▪) represent geometric (Cmax, AUC(0,12 h)) and harmonic (t1/2) mean values.
