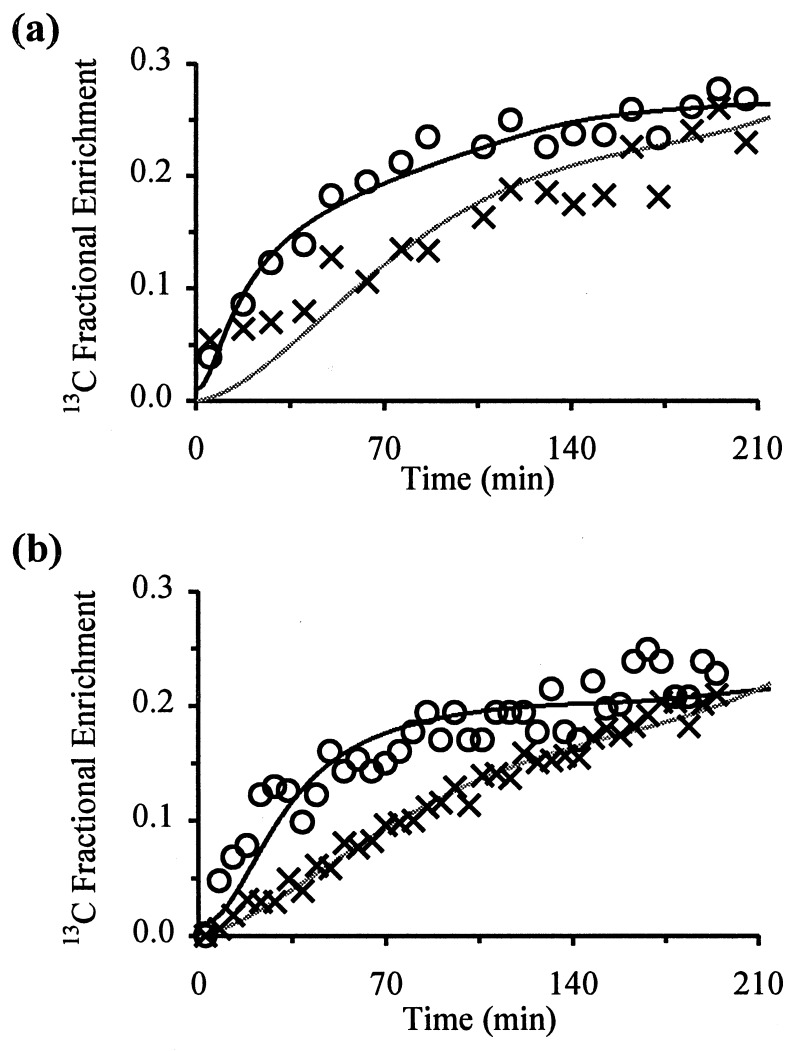
Figure 2.
Fits to the in vivo 13C data for glutamate (○) and glutamine (×) C-4, for a control (a) and hyperammonemic (b) rat. Zero time represents the start of the [1-13C]glucose infusion. Peak heights were converted to fractional enrichments as part of the fitting procedure, and the lines represent the best fit to the data generated by the mathematical model (see Methods). The fit to the glutamate C-4 data gives VTCA, and the fit to the glutamine C-4 data gives the mzximum estimate of Vgln.

