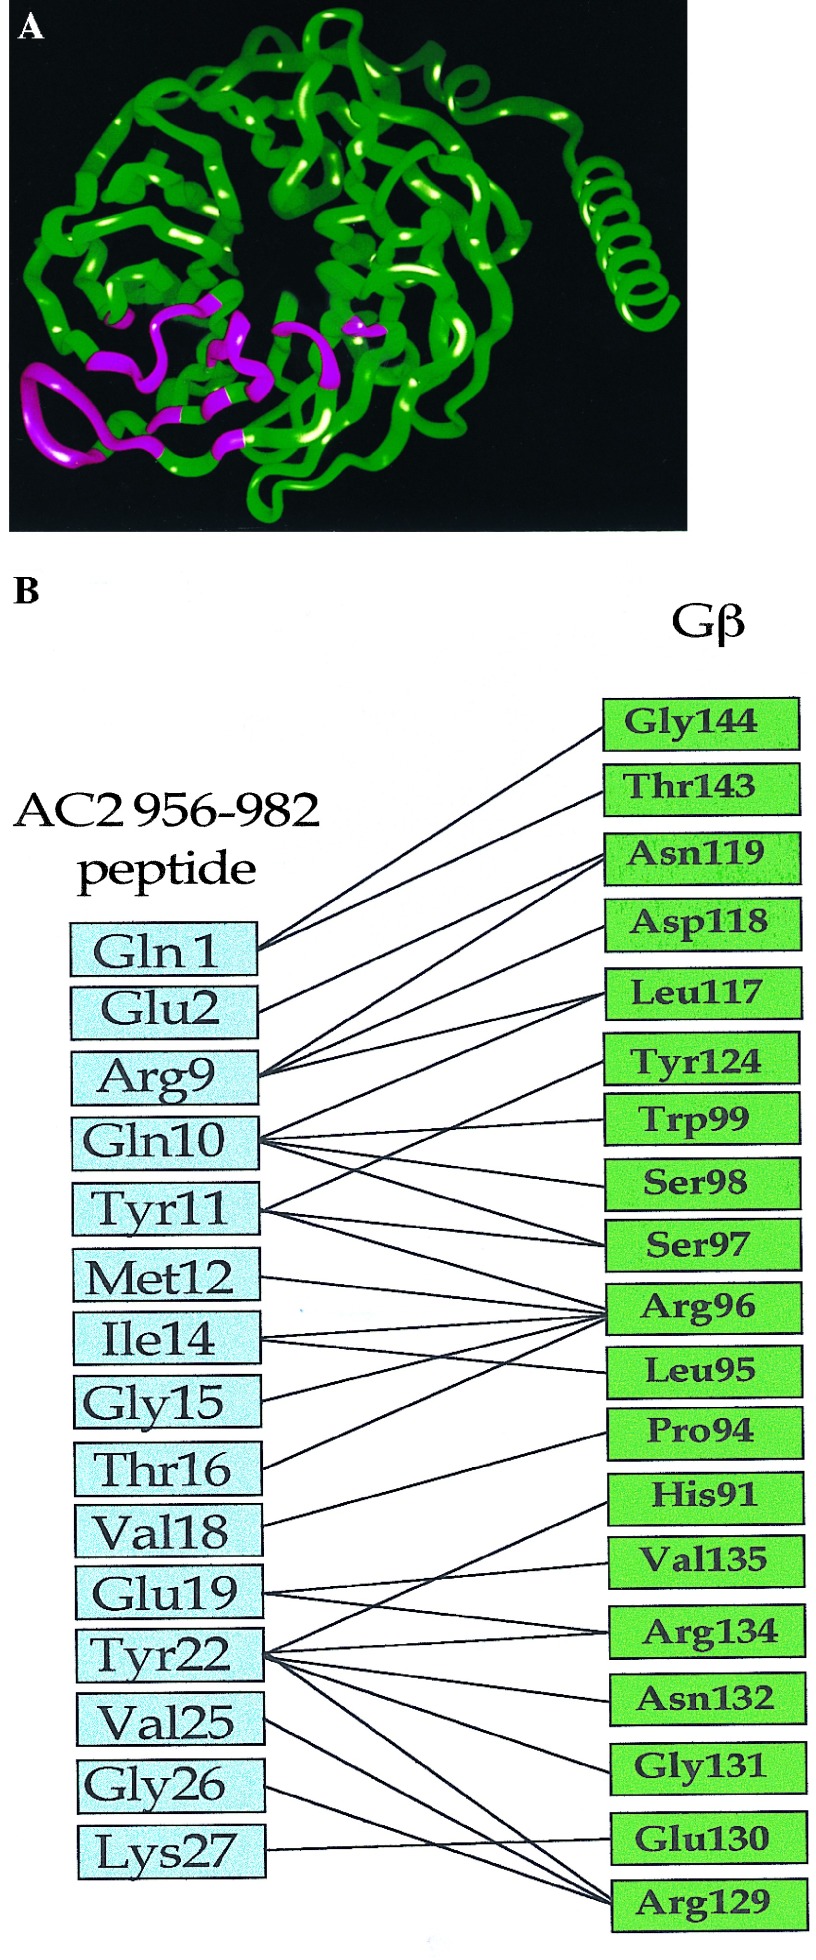
Figure 1.
Regions of Gβ involved in contacts with the AC2 956–982 peptide. (A) A ribbon diagram of the Gβ backbone from the crystal structure of Gβγ (12, 15); the residues in contact with the AC2 peptide are shown in pink (8). (B) Predicted core contacts between the AC2 956–982 peptide and Gβ. The AC2 peptide residues are in the blue boxes. The AC2 peptide residues are numbered 1–27 from the N terminus. Gβ1 residues are in green boxes. The Gβ1 residues are shown in the spatial sequence in which they are predicted to interact with the AC2 peptide.

