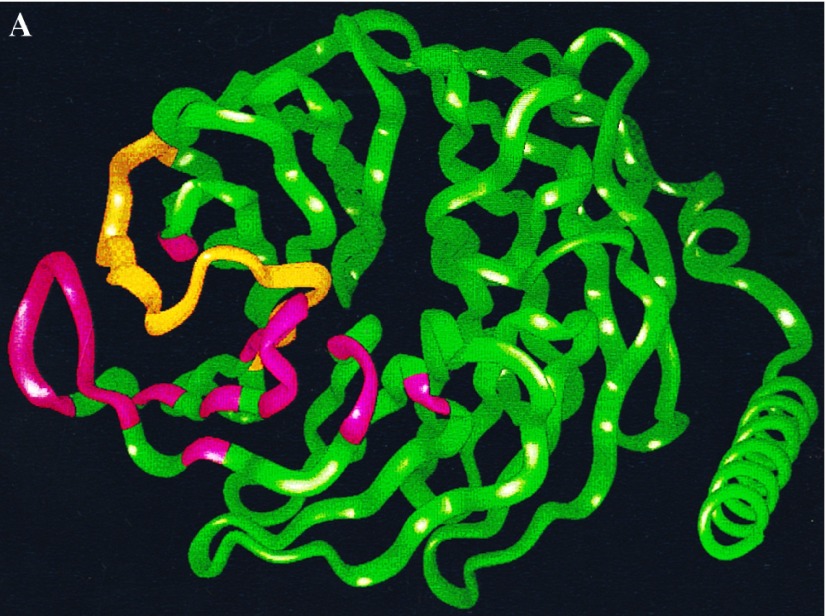
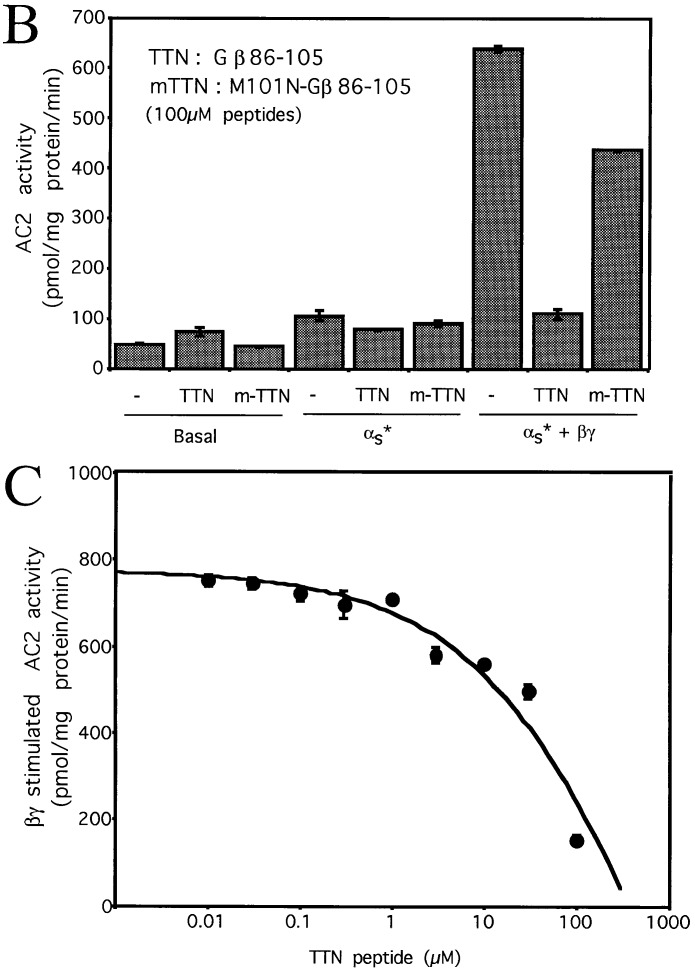
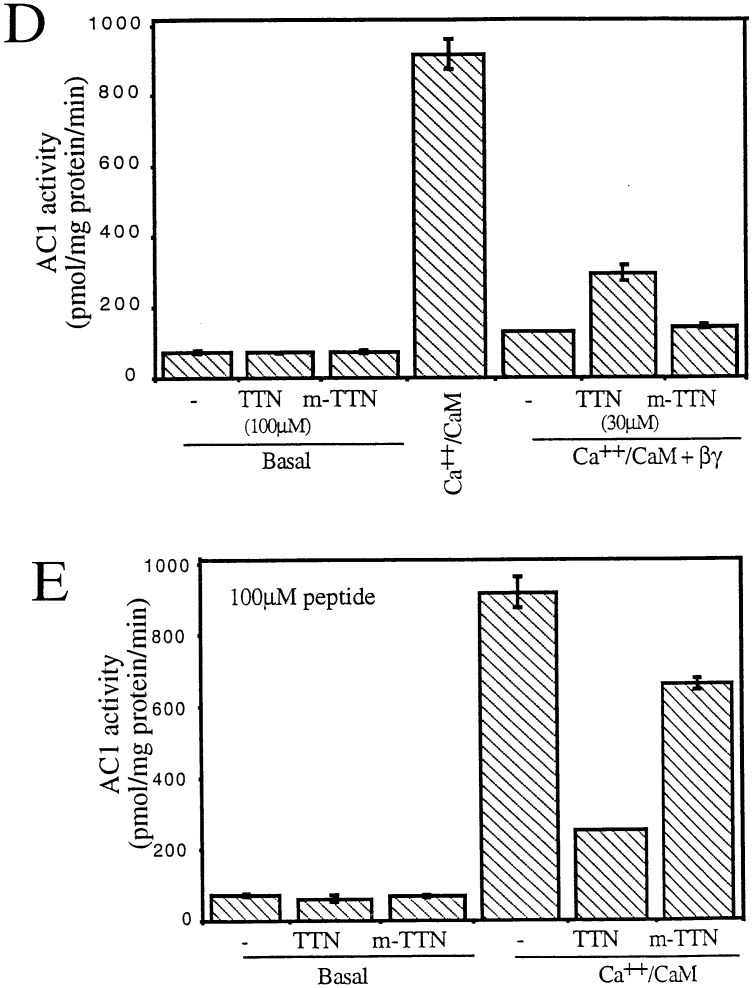
Figure 2.
Effects of the Gβ86–105 peptides on AC2 and AC1 activities. (A) Ribbon diagram of the Gβ backbone with residues 86–105 in yellow. Other residues in contact with the AC2 peptide are shown in pink. (B) Effect of the Gβ86–105 peptide (TTN) and the M101N-Gβ86–105 mutant peptide (m-TTN) on basal, αs* (2 nM), and αs* (2 nM) plus Gβγ (50 nM) stimulated AC2 activities. (C) Effect of various concentrations of TTN peptide on Gβγ-stimulated AC2 activity in the presence of αs* (2 nM). (D) Effect of TTN and m-TTN peptides on basal and CaM (100 nM) plus Gβγ (30 nM) regulated AC1 activities. (E) Effect of TTN and m-TTN peptides on basal and CaM (100 nM) stimulated AC1 activities.


