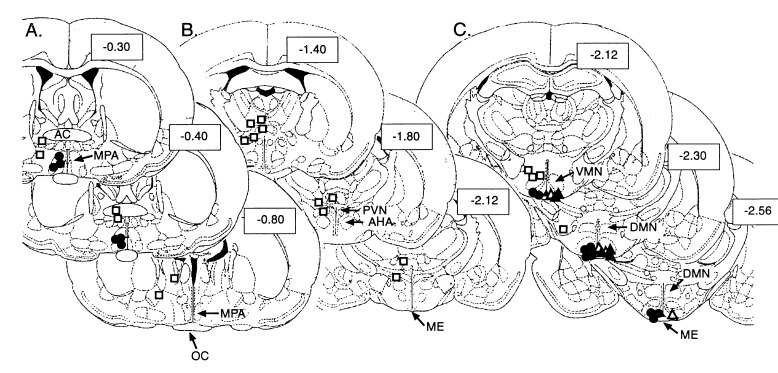
Figure 3.
Diagrammatic representation of the hypothalamic sites receiving grafts of hTGFα-producing 3T3 cells. Although the cells were injected bilaterally, only one site is shown for purposes of clarity. In spite of the intrinsic variability of stereotaxic surgery, the location of contralateral implants was, for the most part, consistent with the depicted sites. The location of control grafts (3T3 cells), though not represented, overlapped with that shown for hTGFα-producing cells. Each series depicts three coronal planes of the suprachiasmatic region (A), anterior hypothalamus (B), and medial basal hypothalamus (C), respectively. The sections outlined correspond to those described in Paxinos and Watson’s atlas of the rat brain (19). The numbers inside boxes represent distance from bregma in millimeters. • and ▴, sites effective in accelerating the onset of puberty; •, PGKIRES-hTGFα; ▴, MT-hTGFα; □, PGKIRES-hTGFα ineffective sites; and ▵, MT-antisense hTGFα. The PGKIRES-hTGFα grafts could not be found in two animals in which the intended site was the POA and two rats in which the intended site was the ME. There were no misplaced MT-hTGFα implants. AC, anterior commissura; AHA, anterior hypothalamic area; DMN, dorsomedial nucleus; ME, median eminence; MPA, medial preoptic area; OC, optic chiasm; PVN, paraventricular nucleus; VMN, ventromedial nucleus.

