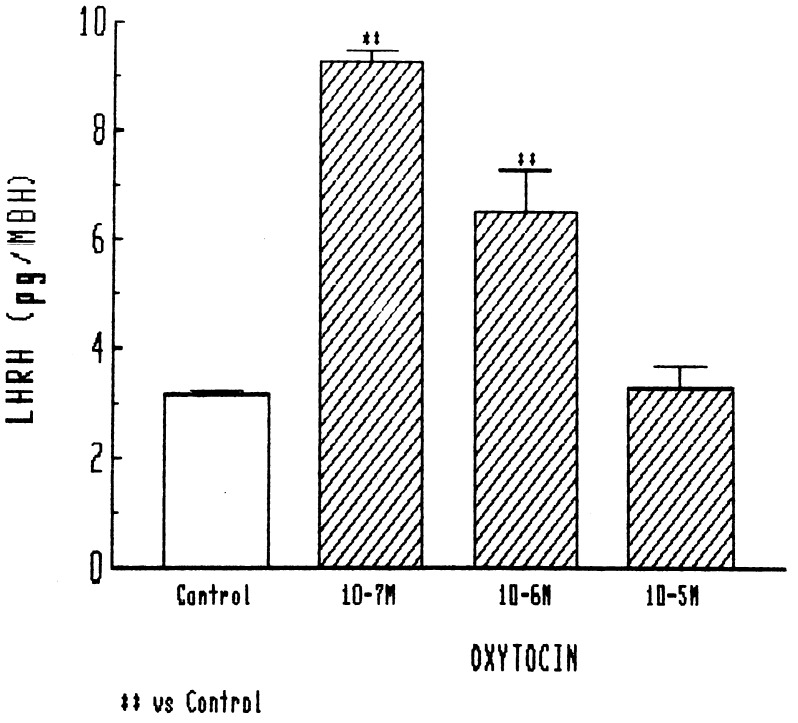
Figure 1.
Effect of different concentrations of oxytocin on LHRH release from MBH explants. In this and subsequent figures, the height of the column indicates the mean, and the vertical line and horizontal bar represent 1 SEM. There were 6 or more determinations per group. ∗∗, P < 0.001 vs. control.

