Figure 3.
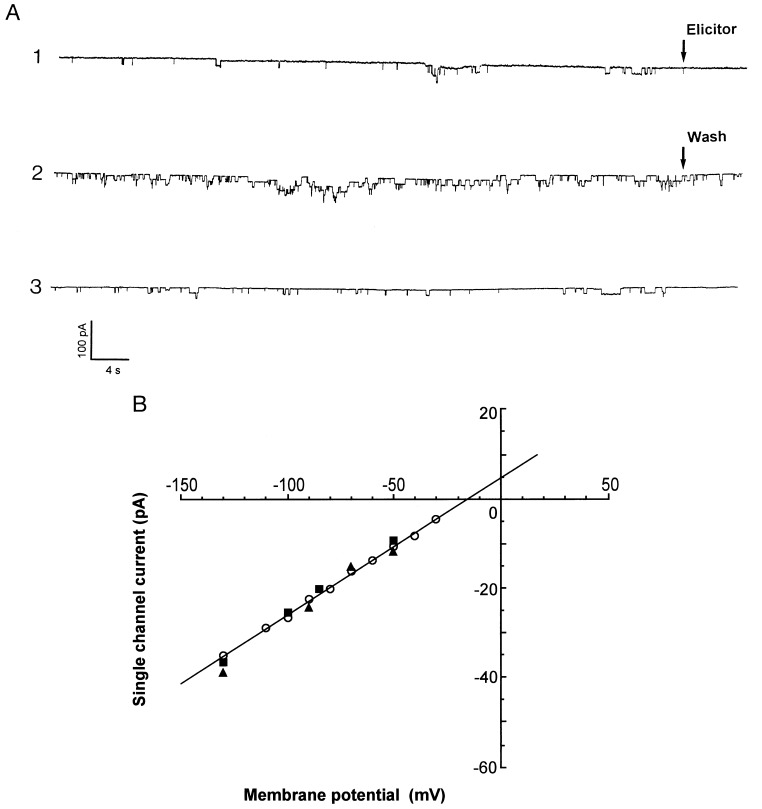
Activation of LEAC by the oligopeptide elicitor Pep-13. (A) Whole-cell recordings of LEAC activity (Vm = −50 mV) under standard conditions before addition (trace 1), 5 min after addition of 100 nM Pep-13 (trace 2), and 5 min after removal of Pep-13 by perfusion (trace 3). Arrows indicate time points of addition of elicitor (trace 1, Elicitor) and start of perfusion (trace 2, Wash). Traces represent recordings of reversible activation by elicitor of LEAC for an individual protoplast (n = 4). Stimulation by elicitor of LEAC activity was 15-fold in this particular experiment. Channel activity was quantified as described in Materials and Methods. (B) I–V plot of unitary currents recorded in whole-cell mode without elicitor (○, taken from Fig. 1B, n = 15), and after addition of 50 μg/ml of the fungal cell wall elicitor (▴, n = 4) or 100 nM Pep-13 (▪, n = 4), respectively.

