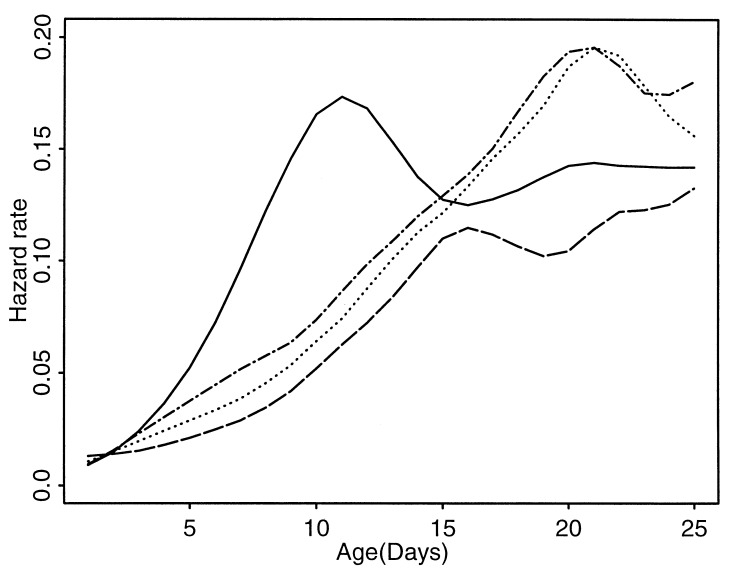
Figure 3.
Peak-aligned estimated hazard rates from 0 to 25 days. Hazard rates are shown separately for the four groups: females, protein-deprived (solid); females, sugar-plus-protein diet (dashed); males, protein-deprived (dash-dot); males, sugar-plus-protein diet (dotted). Each curve is based on an initial number of more than 100,000 individuals. Time is in days on the x axis.

