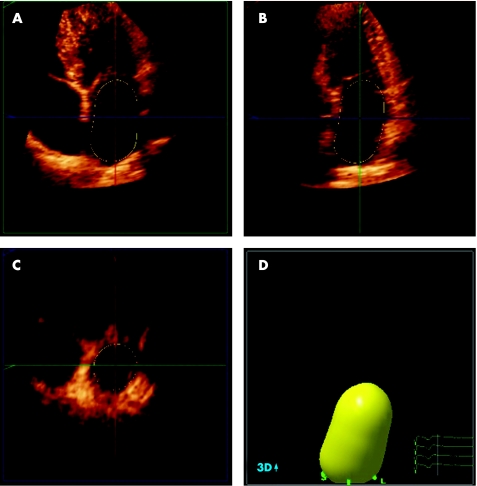
Figure 2 Real‐time three‐dimensional echocardiogram for the assessment of LA volumes. Panels A to C represent the coronal, sagittal and transverse planes, respectively. With the use of a five‐point tracing algorithm, LA volumes can be obtained throughout the cardiac cycle, represented by the “shell” in panel D. In this example, LA maximum volume was 53 ml.

An official website of the United States government
Here's how you know
Official websites use .gov
A
.gov website belongs to an official
government organization in the United States.
Secure .gov websites use HTTPS
A lock (
) or https:// means you've safely
connected to the .gov website. Share sensitive
information only on official, secure websites.
