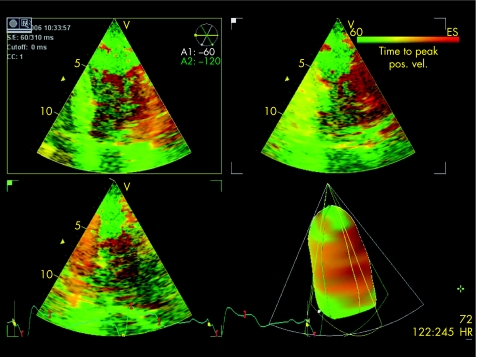
Figure 7 Example of tissue synchronisation imaging applied to a triplane dataset. The areas of latest mechanical activation are indicated in orange/red in the apical four‐, two‐ and three‐chamber views. The lower right panel shows a semiautomatically generated three‐dimensional LV volume portraying the area of latest mechanical activation.

An official website of the United States government
Here's how you know
Official websites use .gov
A
.gov website belongs to an official
government organization in the United States.
Secure .gov websites use HTTPS
A lock (
) or https:// means you've safely
connected to the .gov website. Share sensitive
information only on official, secure websites.
