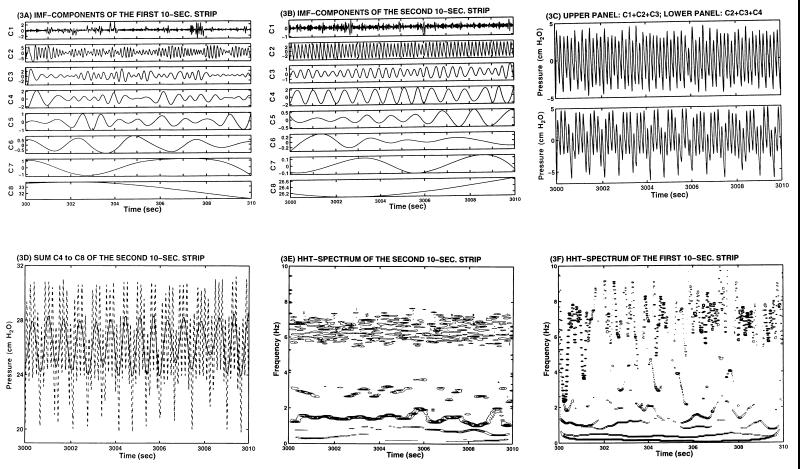
Figure 3.
The IMF and Hilbert Spectrum (HHT) of the blood pressure data. (A) IMF of the first 10-s strip of data shown in Fig. 1C, Upper. (B) IMF of the second 10-s strip shown in Fig. 1C, Lower. (C) Upper: sum C1+C2+C3; Lower: sum C2+C3+C4 of the second 10-s strip. (D) Sum C4–C8 of the second 10-s strip of data, IMF in B, is shown by the solid line, which reveals the slow variation of the blood pressure. The full signal, which is shown in the lower panel of Fig. 1C, is replotted here by the dotted line. (E) HHT spectrum of the second 10-sc strip. (F) HHT spectrum of the first 10-s strip. The residual R8 in both cases are zero.

