
Fig. 2.
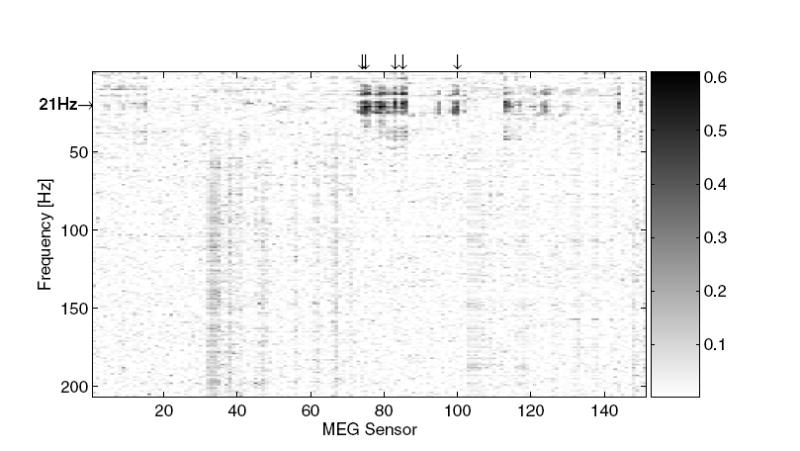
Spectral map of determination coefficients computed from three runs (54 trials) selected from participant A’s second training session. Arrows on the top indicate sensors used to compute the feedback signal, and an arrow on the left indicates the frequency entering into fig. 3.