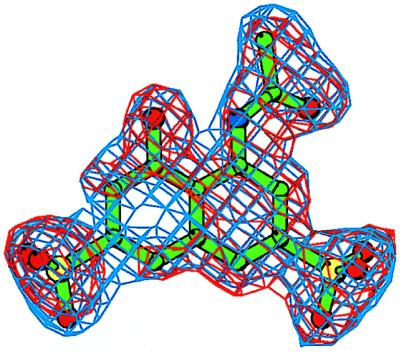
Figure 3.
An electron density (ED) map for the inhibitor Y-3. The initial Fo–Fc ED map is contoured at the 2.5σ level (red); the final 2Fo-Fc ED map is contoured at the 1.1σ level (blue). The refined conformation of the Y-3 model is shown in green. Prepared with bobscript, a modification of molscript (36).

