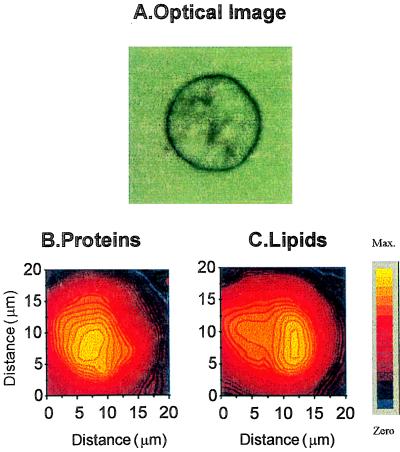
Figure 2.
Chemical distribution of the protein and lipid characteristics of IR bands (amide II and CH2 asymmetric stretching bands, respectively). (A) Optical image. (B) Protein distribution. (C) Lipid distribution. The mapping has been obtained by analyzing the intensity variation of a two-dimensional set of infrared spectra (14×14 points, step equal to 3 μm). Each spectrum was recorded in transmission through a 3×3-μm2 aperture. The total recording time was 180 min. The spatial resolution is about between 2 and 3 μm.

