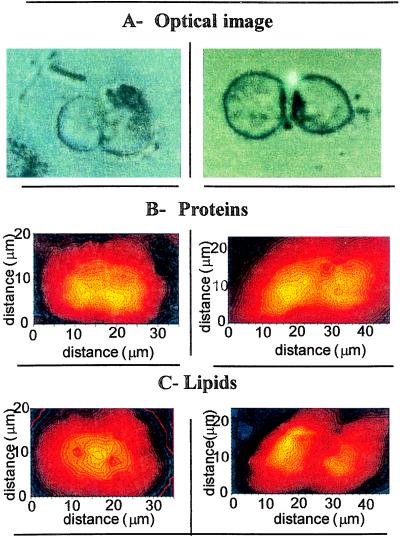
Figure 3.
Chemical distribution of proteins and lipids of cells undergoing mitosis. (A) Optical image. (B) Protein. (C) Lipid distributions. The images of protein and lipid distribution result from the analysis of sets of infrared spectra: 18×11 spectra every 2-μm step (aperture size 5×5 μm2, 4 cm−1 resolution, 128 scans for each spectrum) (B Left and C Left), and 13×9 spectra every 3-μm step (aperture size 3×3 μm2, 4 cm−1 resolution, 128 scans per spectrum) (B Right and C Right) were recorded.

