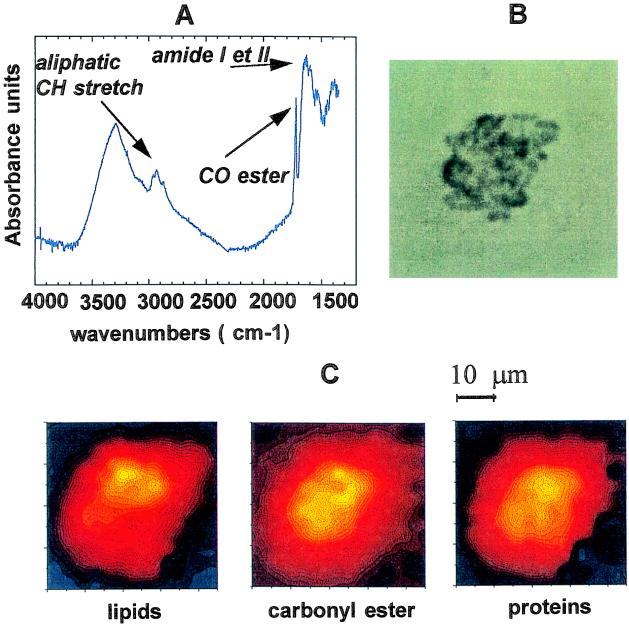
Figure 4.
Infrared spectrum and chemical distributions of functional groups of a necrotic cell. (A) Infrared spectrum recorded with an aperture of 5×5 μm2. The instrumental resolution was set at 4 cm−1, and the spectrum displayed is the result of 128 co-added scans. (B) Optical image. (C) Lipid, carbonyl ester group, and protein distributions. The chemical distributions are the result of the analysis of 15×14 spectra; each spectrum is recorded every 3-μm step by using an aperture size of 5×5 μm2 and a 4 cm−1 resolution (128 scans per spectrum).

