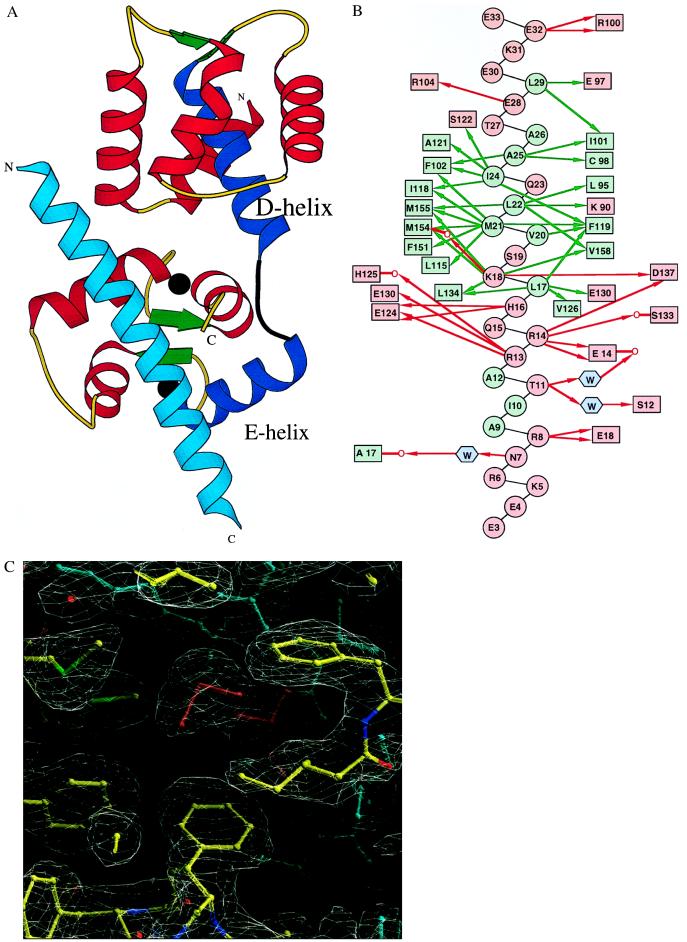
Figure 1.
Structure of the TnC/TnI1–47 complex. (A) Ribbon diagram of the TnC/TnI1–47 complex structure. The α-helices, β-strands, and loops of TnC are in red, green, and yellow, respectively. The unwound and kinked central D/E α-helix of TnC is shown in blue, and the interdomain extended linker is black. The two calcium ions in the TnC C-lobe are shown as black balls. The TnI1–47 α-helix is in cyan. The figure was drawn with the molscript program (21). (B) Hydrophobic (green arrows) and polar (red arrows) side-chain interactions between TnI1–47 (circles) and TnC (rectangles) residues in the TnC/TnI1–47 complex. The hydrophobic and polar residues are shown in green and red, respectively. Water molecules are shown as cyan hexagons. Main chain carbonyl oxygens of the interacting amino acids are shown as a red O attached to the subsequent residues. (C) Portion of the final (2Fo-Fc) electron density map and the TnC/TnI1–47 model (ball and stick) in the hydrophobic cavity of the C-lobe of TnC. The TnI and TnC residues are shown in cyan and atom-dependent (C, N, O, and S are yellow, blue, red, and green, respectively) colors, respectively. Met-21, protruding into hydrophobic cleft of TnC, is colored red. The figure was produced with the o program (19).

