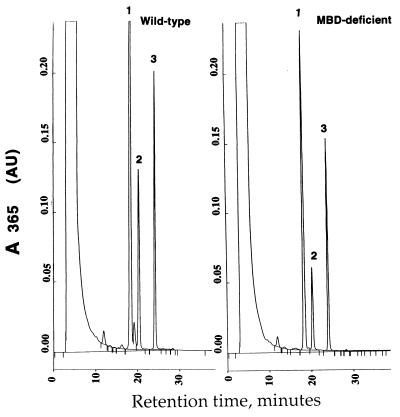
Figure 4.
Analysis of cys-bis-gly metabolism in kidney homogenates from wild-type and MBD-deficient mice. For details on assay conditions and sample preparation, see Materials and Methods. (A) HPLC profile of cys-bis-gly metabolism by homogenates of wild-type kidney. The peaks labeled 1, 2, and 3 represent cys-gly, cysteine, and the internal standard γ-glu-glu, respectively. (B) HPLC profile of cys-bis-gly metabolism in kidney homogenates from MBD-deficient mice.

