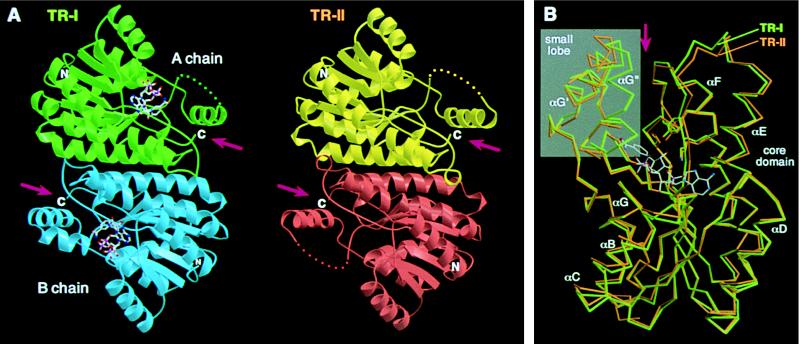
Figure 2.
(A) Structures of TR dimers. Subunits of TR-I (green and blue) and TR-II (yellow and red) are related, respectively, by a noncrystallographic and crystallographic twofold axis positioned at the center of each dimer and oriented perpendicular to the plane of the figure. NADP+ bound in the TR-I subunits is shown by ball-and-stick models. Disordered regions in chain A of TR-I and both of the TR-II subunits are shown by dots. (B) Cα traces of TR-I (green) and TR-II (orange) subunits are superimposed by the program lsqkab (9) using all possible Cα pairs. The binding position of NADP+ in TR-I and the side chains of the three catalytic residues also are shown. The small lobes are shown in a gray background. Arrows indicate the clefts formed between the core domain and the small lobe (A and B). The figures were prepared by using the programs molscript (13) and raster3d (14).

