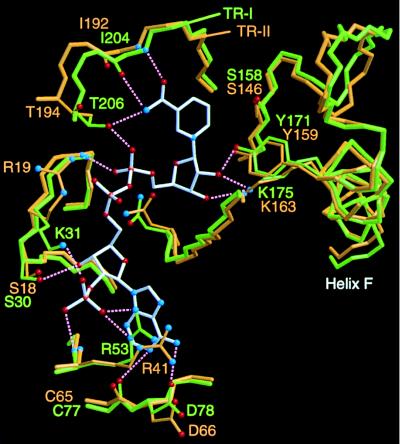
Figure 4.
Superimposition of the region encompassing the cofactor binding site and catalytic residues of TRs. The binding position of NADP+ (bonds shown in white) was determined for TR-I. Bonds in the TR-I and TR-II proteins are shown in green and orange, respectively. For simplicity, only the protein side chains that directly interact with the cofactor atoms are shown. Possible hydrogen bonding interactions are indicated by dotted lines, although many other hydrogen bonding interactions through water molecules could be predicted from the structural model. Three catalytic residues (Ser, Tyr, Lys) are shown at the right. The figure was prepared by using the programs molscript (13) and raster3d (14).

