Figure 5.
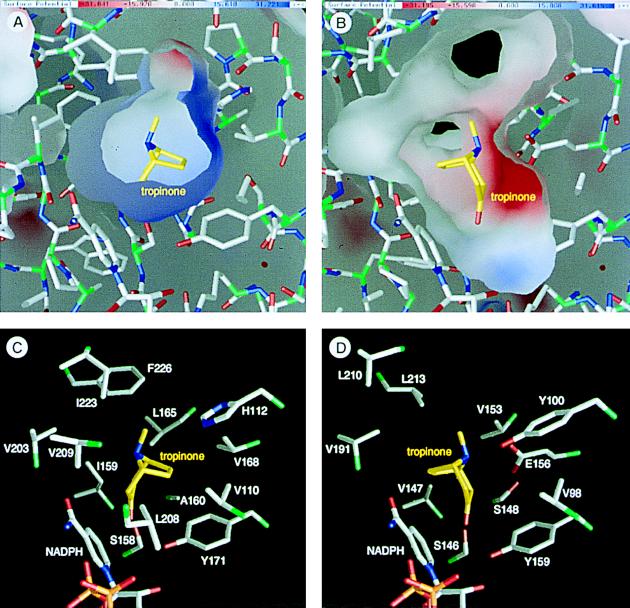
Environments of the substrate binding sites and the binding models of tropinone. (A and B) Inner molecular surfaces of the tropinone binding pockets of TR-I (A) and TR-II (B). Electrostatic charge distributions are shown on the molecular surfaces in blue (positive charge) and red (negative charge). Note that the inner surface of TR-II (B) is somewhat deformed at the lower left corner due to the absence of several residues that constitute the small lobe. (C and D) Amino acid side chains that form the tropinone binding pockets viewed from the same direction as in A and B. Two TR-II residues (D) corresponding to the Leu-208 and Val-209 of TR-I (C) are missing in this structural model. Bonds from the carbon atoms in tropinone are shown in yellow, whereas the protein bonds from the Cα atoms are green to half their lengths. This figure was prepared by the grasp program (23).

