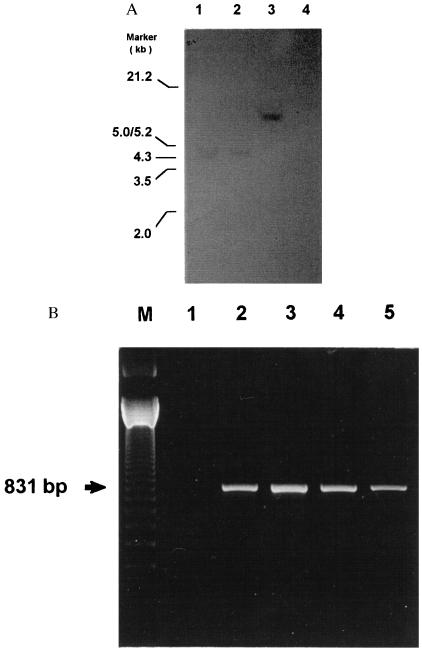
Figure 2.
(A) Radiograph of Southern blot analysis of genomic DNA prepared from the AGLCL 1.3-kb CATR1 cDNA antisense tranfected cells. This autoradiograph shows the integration of the vector into the genomic DNA. Each lane in the figure received 10 μg of DNA digested with EcoRI, and the membrane was probed with the labeled vector-specific neo-resistant gene probes. The arrows indicate the location on the gel of the vector DNA. Similar results were obtained by using three different transfected cell lines. The origin of the DNA is indicated at the top of each lane, i.e., lanes 1–3 were prepared from three different transfected cell lines, and lane 4 contained genomic DNA prepared from untransfected AGLCL cells. (B) Data are presented showing the RT-PCR amplification of the expressed neo selection marker. In each case 1 μg of RNA was used for the RT reaction. Oligo(dT) was used as the first strand primer in the reaction. One-tenth of the RT reaction mixture was used for PCR amplification by using primers for the Neo-1 and Neo-2 genes. These primers would amplify a 831-bp neo-specific product.

